
[Home] [Puzzles & Projects] [Delphi Techniques] [Math topics] [Library] [Utilities]
|
[Home] [Puzzles & Projects] [Delphi Techniques] [Math topics] [Library] [Utilities]
|
|
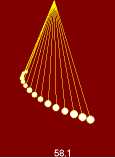
Problem DescriptionModel the harmonic motion of a set of simple pendulums of given lengths when set in motion from the same position. Should have called called it "Pendulum Waves"! Background & TechniquesMost everyone knows that frequency of a pendulum depends on its length, not the weight of the weight of its bob. A video of a physical model with 15 pendulums demonstrates interesting patterns when viewed down the line of bobs. Pendulums are set at lengths which produce frequencies differing by one cycle per minute from the ones adjacent. The model shown is part of a collection of Physics models at Harvard University. The video has been posted at Wimp.com which also has a link to the video at the Harvard site. The source of the original model seems uncertain, but it is interesting and seemed worth modeling in software. Here are a few clips from the animation with times since starting with all at 30 degrees left.:
The length of the pendulums in the Harvard model are set so that the longest pendulum has a frequency of 51 cycles per minute, the next shorter one swings 52 times per minute, etc. up to 65 cycles per minute for the 15th pendulum. I made these default lengths in my model but allow the number of pendulums to be varied from 1 to 20 and frequency of the longest to range from 1 to 60 cycles per minute. Faster swings seem to generate the patterns too rapidly to appreciate. Similar to real pendulums, I have incorporated slight damping into the pendulums so that oscillations die out after 4 minutes. For the 15 pendulum case only, I also attempted to visualize depth by drawing the shorter pendulums with smaller bobs., Non-programmers are welcome to read on, but may want to jump to bottom of this page to download the executable program now. Programmer's Notes:The original pendulum DFF work numerically solved the differential equation which describes the position, speed, and acceleration of the bob over time. It used our Runge-Kutta differential equation solver unit. For this project, I decided to use the simpler equation as described in the "pendulum (mathematics)" Wikipedia article. It replaces the "sin{theta)", the sine of the displacement angle in the differential equation, with "theta" which allows the direct calculation of theta as a function of the initial position of the pendulum, (theta0), gravity, (g), length for pendulum "i", (lengths[i]) and the run time, (time). theta:=theta0*cos(sqrt(g/lengths[i])*time). The equation is pretty good for small angles, less than 1% up to around 20 degrees because theta and sin(theta) are very nearly identical in that range. (Think of how nearly identical are the arc length and the chord length of a circular sector at small angles.) The errors affect all pendulums equally and so do not accumulate to distort the generate patterns over the course of a run. I predefine the lengths in an array using the Christian-Huygens small-angle approximation equation for length as a function of the period: Length=Period2*g/(2Pi)2. In our case, the periods are defined to be the inverse of cycles per minute and cycles per minute are defined as Cycles+index for index values from 0 to the number-of-pendulums -1 where Cycles is the slowest pendulum cycles per minute defined by the user. So the loop to generate the lengths looks like this: for i:=0 to high(Lengths) do lengths[i]:=sqr(60/(cycles+i))*Gdiv4PiSq; where Gdiv4PiSq is the pre-defined constant expression for g/(2Pi)2 just to save a little computation time. Drawing is straightforward on the Canvas property of a TImage control. Within a loop over all pendulums for each time step, we compute the angle, draw a yellow line from the top center for the specified length (scaled so that the longest pendulum reaches 75% of the image height), then draw a circle of the predefined size at the end of that line. The image.update method is called after all pendulums have been redrawn to display the pendulums in their new position. I update positions 50 times per second but how to control the display operation to run at that rate? I keep track of real time (wall clock time) and virtual time (time used in the equations to redraw the pendulums). If wall clock time is behind virtual time, I stop the virtual clock using the Sleep function waiting for the real clock time to catch up to the virtual clock time. Enjoy! Running/Exploring the Program
Suggestions for Further Explorations
|
[Feedback] [Newsletters (subscribe/view)] [About me]Copyright © 2000-2018, Gary Darby All rights reserved. |